
Sequence of Returns Risk: Why Order Beats Average
Two retirees can earn the identical compound return over thirty years and finish $2.7 million apart. One of them can go broke. Nothing separates them except the order the returns showed up in, and that is a much bigger deal than almost anyone budgets for.
Key takeaways
- Two retirees can earn the identical 10.26% compound annual return over thirty years and finish $2,675,360 apart: the S&P 500's 1996 to 2025 total returns applied in calendar order to a $1 million portfolio with 4% inflation-adjusted withdrawals end at $7,793,981, while the exact same returns applied in reverse order end at $10,469,341.
- The order of returns is mathematically irrelevant when there are no cash flows. A $1 million lump sum left completely alone grows to exactly $18,717,165 across those thirty years whether the returns run forward or backward, because multiplication does not care about order.
- An investor who retired in January 2000 with $1 million entirely in the S&P 500, taking 4% in year one and raising it 3% annually for inflation, ran out of money in 2023, while an identical investor who withdrew nothing turned $1 million into $7,388,152 over the same 26 years.
- A January 2000 retiree drawing 4% from $1 million and holding an annually rebalanced 60/40 stock and bond portfolio instead of 100% stocks finished 2025 with $965,495, roughly the balance they started with, which makes allocation the defense that carried the most weight.
- Michael Kitces measured the correlation between a retiree's first-year return and their safe withdrawal rate at just 0.21, against 0.79 for first-decade real returns, so sequence risk is a slow decade-long problem rather than a single-crash problem.
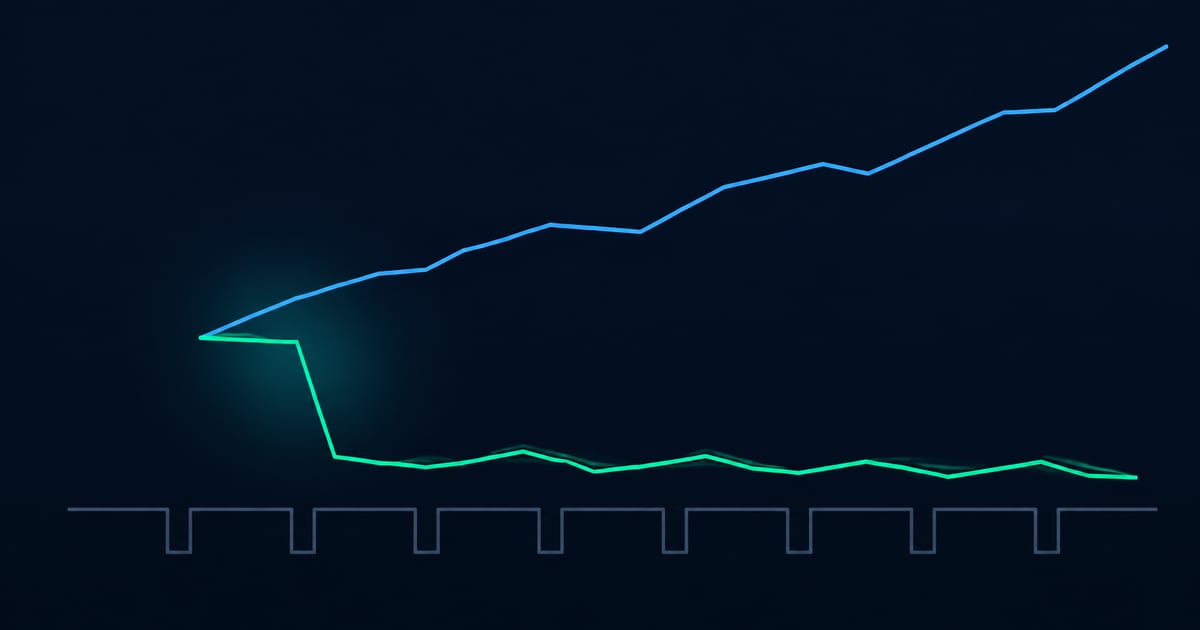
Here are two retirees. Both start with $1 million. Both hold the same fund. Both take out 4% in year one and raise it 3% a year for inflation. Over thirty years they earn the exact same compound annual return, down to the decimal: 10.26%.
One finishes with $7,793,981. The other finishes with $10,469,341.
The only difference is the order the returns arrived in. That is a $2,675,360 spread produced by nothing but scheduling, and it is the single most under-appreciated number in retirement planning.
The first time I ran this I assumed I had a bug in the loop. I did not. Order is a real, enormous, uncompensated risk, and it has a name: sequence of returns risk.
The experiment: run thirty real years forward, then backward
I used the S&P 500 annual total returns from 1996 through 2025, the series NYU Stern maintains from market data and updates every January.[1] Thirty years, dividends reinvested, no fees. The arithmetic average is 11.80% a year and the compound rate is 10.26%.
Retiree A gets them in calendar order, so 1996 first. Retiree B gets the identical thirty numbers in reverse, so 2025 first and 1996 last. Both start with $1 million, both withdraw $40,000 at the start of year one, and both raise the withdrawal 3% every year after.
Both retirees pull out exactly $1,903,017 across the thirty years. Same money in, same money out, same average. Watch what happens in between.
Calendar order, 1996 first
Same returns, reversed
- Balance after 7 years$1,296,968$2,413,993
- Balance after 13 years$1,235,958$4,248,117
- Balance after 20 years$2,463,059$5,129,572
- Balance after 30 years$7,793,981$10,469,341
Takeaway
The gap opens early and never closes. By year 13 the calendar-order retiree is holding $1.24 million against the reversed retiree's $4.25 million, and the reversed retiree stays ahead through a full thirty years of identical returns.
And this sequence was kind. Ten percent a year compounded is a genuinely good thirty years, which is why nobody actually goes broke in the chart above.
Raise the withdrawal to 7% and the mercy runs out: the calendar-order retiree is scraping the account for a final $21,378 in year 29 and is done, while the reversed retiree closes year 30 with $4,283,473 still in the account. Same returns. Same withdrawal rule. One of them ran out of money.
Why the order is free while you are saving and fatal while you are spending
Okay, here is the part that took me a while to get comfortable with, because on its face it sounds like the market treats savers and spenders differently. It does not. The math is the same. The cash flows are what change.
Leave $1 million alone across those thirty years, no deposits, no withdrawals, and it becomes $18,717,165. Reverse the returns and it becomes $18,717,165. Not approximately. Exactly.
You are multiplying the same thirty growth factors together and multiplication does not care what order you do it in. That is the whole reason compounding behaves so predictably over long holding periods when nothing is moving in or out.
Add a withdrawal and the commutative property dies, because now you are selling shares at whatever price the market happens to be quoting that year.
Say your fund trades at $1,000 a unit and you need $50,000. In a normal year you sell 50 units. In a year like 2008, when the S&P 500 total return was -36.55%, that unit is worth $634.50 and the same $50,000 costs you 78.8 units.
You just sold 57.6% more of your portfolio to buy the same groceries, and those 28.8 extra units are gone. They do not come back in 2009. A paper loss becomes a permanent one at the exact moment you convert it into a sale.
Summary
“A bad year does not hurt a retiree because the number is negative. It hurts because the retiree has to sell into it.”
Now, the version of this you usually hear is that order does not matter at all during accumulation. That is only true for a lump sum.
Run those same thirty years with someone contributing $20,000 annually and they end at $4,004,562 in calendar order against $3,145,559 reversed, a 27.3% gap. Order still matters.
What is different is that it can never ruin them, because a saver hitting a crash is buying units cheap rather than liquidating them cheap. Sequence risk does not appear at retirement. It flips sign. That is also why the lump-sum versus dollar-cost-averaging argument lands so differently before and after you stop earning.
The two dates that made this famous: 1966 and 2000
William Bengen, a financial planner in Southern California, ran the original version of this study for the Journal of Financial Planning in October 1994.
He tested rolling 30-year retirements against actual US stock, bond and inflation history and concluded that a 4% first-year withdrawal “should be safe,” because “in no past case has it caused a portfolio to be exhausted before 33 years.”
He also found that a 5% withdrawal “survived only about 20 years” for people who retired in the late 1960s and early 1970s.[2] That gap between 4% and 5% is the whole conversation. Later work refined the worst case to a 4.15% starting rate for a 1966 retiree holding 50/50 stocks and bonds.[3]
Why 1966? Because the Dow sat at 983 in January 1966 and closed at 991 in October 1982, going absolutely nowhere for sixteen years while monthly CPI climbed from 0.9% to 13.6% at its 1980 peak.[4]
Flat nominal markets are survivable. Flat nominal markets plus double-digit inflation are not, because the withdrawal keeps ratcheting up while the portfolio does not. The 1966 retiree was not killed by a crash. They were killed by sixteen years of nothing.
The modern version is January 2000, and I ran it rather than quoting it. Same rules as before: $1 million, all in the S&P 500, $40,000 in year one, 3% annual inflation adjustment.
Retired January 2000
$1,000,000, 100% S&P 500, 4% initial withdrawal raised 3% a year
- End of 2002$539,242
Three consecutive down years
The S&P 500 returned -9.03%, -11.85% and -21.97%. Selling into all three cut the balance nearly in half while $123,636 of withdrawals came out.
- End of 2007$667,301
The recovery that was not one
Five straight positive years, including +28.36% in 2003, and the portfolio is still a third below where it started. The withdrawal is now $49,195.
- End of 2008$391,252
The second hole
A -36.55% year on a balance that never healed from the first one. This is where the outcome was decided.
- End of 2021$109,801
The longest bull run in history was not enough
Twelve mostly excellent years, including +32.15% in 2013 and +31.21% in 2019, and there is not much left to compound. The withdrawal has grown to $74,412.
- 2023$0
Out of money
The final partial withdrawal of $27,175 empties the account with three years still to run. Meanwhile $1,000,000 left untouched over the same 26 years became $7,388,152.
Takeaway
The 2000 retiree earned an 8.00% compound annual return on their fund. The fund did its job. The retiree still went broke, because the two worst stretches landed in the first nine years, when the balance was biggest and every dollar withdrawn cost the most shares.
What actually defends against it, honestly ranked
Most of the advice here is soft. Some of it is measurable. Start with the measurable part, because it is also the least glamorous.
Diversify and rebalance. Take that identical January 2000 retiree and put them in a 60/40 stock and bond portfolio rebalanced annually instead of 100% equities. They finish 2025 with $965,495, within 4% of the $1,000,000 they started with, instead of zero.
Ten-year Treasuries returned +16.66%, +5.57% and +15.12% in the three years the S&P 500 was falling apart, and +20.10% in 2008.[1] That is what a second asset is for: something to sell that is not down.
If you take one thing from this piece, make it an actual rebalancing policy you follow on a schedule, because rebalancing is the mechanism that forces you to sell the winner and hold the loser through the exact years you will not want to.
Hold a cash or short-bond bucket sized in years, not dollars. Two to three years of spending in something that does not move means you never have to fund a grocery bill by selling equities down 37%. It is the same instinct as an emergency fund measured in months of expenses, scaled up for a household with no paycheck.
The honest cost is drag: three years of spending parked in T-bills is roughly 10% of a portfolio earning a low return for decades. I think that is a fair price for removing forced selling, but it is a price, not a free lunch.
Consider a rising equity glidepath. Michael Kitces and Wade Pfau tested portfolios that start conservative and get more aggressive through retirement, which is the opposite of what target date funds do.
A path from 30% to 70% equities produced a 95.1% success rate against 93.2% for a static 60/40, and at the 5th percentile it lasted about 30 years against 27.7.[5] The logic is exactly the mechanism above: hold the least equity when the balance is largest and the sequence exposure is worst.
I find this genuinely persuasive and I also notice it asks retirees to buy more stock at 75 than at 65, which almost no retiree does.
Spend flexibly. The fixed inflation-adjusted withdrawal in every simulation above is a fiction. Real people cut back after a bad year. Guardrail rules formalize that by trimming the withdrawal when the portfolio falls past a threshold and raising it when it runs hot.
Morningstar's The State of Retirement Income, 2025 edition, published December 3, 2025, puts the safe starting rate at 3.9% for a 30-year horizon at 90% success with 30% to 50% in equities, and notes that acknowledging that real spending declines with age is worth roughly another percentage point.[6]
Flexibility is the cheapest defense on this list and the one people resist hardest, because it means the plan can tell you no.
Delay Social Security. For anyone born in 1960 or later, full retirement age is 67, and waiting until 70 raises the benefit to 24% above the full amount while claiming at 62 cuts it by 30%.[7] That is an inflation-linked, government-backed income stream you cannot outlive, bought with three years of patience.
Every dollar it covers is a dollar you are not selling shares to produce. It is the best longevity hedge available to a normal household and it costs nothing but the willingness to spend down other assets first.
Heads up
The part that changes how you plan
Sequence risk is usually described as crash risk, and that framing is wrong in a way that leads people to the wrong defense. Kitces measured it: the correlation between a retiree's first-year return and their eventual safe withdrawal rate is only 0.21. The correlation with first-decade real returns is 0.79.[8]
A single bad year is noise. A mediocre decade is the thing that kills you, and a mediocre decade does not announce itself. There is no headline, no circuit breaker, no moment where anyone rings a bell.
Which means the defense cannot be a reaction. You cannot see it coming and you cannot time your way out of it.
The 2000 retiree above did not make a single mistake in 26 years; they held a diversified index fund through everything and followed the most famous rule in retirement planning. They just happened to start on a bad Tuesday.
So build the defenses before you need them. Get the allocation right while you still have a paycheck, fund the cash bucket in the last year of work rather than in the first bad quarter, write the spending rule down while you are calm, and treat the 4% rule as a starting estimate rather than a promise.
The order of returns is the one variable in your plan you have absolutely no say over. Everything else on this page, you do.
Sources and further reading
- 1.DataAnnual Returns on Stock, T.Bonds and T.Bills: 1928 to Current. NYU Stern School of Business. Source of every S&P 500 and 10-year Treasury annual total return used in this article. Last updated January 5, 2026.
- 2.PrimaryWilliam P. Bengen, "Determining Withdrawal Rates Using Historical Data," Journal of Financial Planning, October 1994. The paper that produced the 4% rule. Also recommends a stock allocation "as close to 75 percent as possible, and in no cases less than 50 percent."
- 3.ReportingMcLean Asset Management, "William Bengen's SAFEMAX". Documents the 4.15% worst-case starting withdrawal rate for a 1966 retiree at a 50/50 allocation.
- 4.ReportingAndy Serwer with Dylan Croll, "How to survive the worst bear market of all time," Yahoo Finance, September 24, 2022. Dow at 983 in January 1966 and 991 in October 1982; monthly CPI from 0.9% to 13.6% in June 1980.
- 5.ReportingMichael Kitces, "The Benefits Of A Rising Equity Glidepath In Retirement". Summarizes the Kitces and Pfau research: a 30% to 70% rising glidepath scored 95.1% success against 93.2% for a static 60/40.
- 6.ReportingKeil Financial Partners summary of Morningstar, "The State of Retirement Income: 2025 Edition," published December 3, 2025. 3.9% starting withdrawal rate, 30-year horizon, 90% success, 30% to 50% equity weighting.
- 7.PrimaryConsumer Financial Protection Bureau, "Before You Claim". Full retirement age 67 for those born after 1960; claiming at 70 pays 24% above the full benefit, claiming at 62 pays 30% below it.
- 8.ReportingMichael Kitces, "Understanding Sequence Of Return Risk, Safe Withdrawal Rates, Bear Market Crashes And Bad Decades". First-year return correlates with the safe withdrawal rate at 0.21; first-decade real returns correlate at 0.79.
Frequently asked questions
- What is sequence of returns risk?
- Sequence of returns risk is the danger that the order in which investment returns arrive, not their average, determines whether a retirement portfolio survives. It only bites when money is being withdrawn. Selling shares during a downturn to fund living expenses permanently removes shares that would otherwise have participated in the recovery, so a bad first decade does damage that a good second decade cannot undo.
- Why doesn't the order of returns matter while you are still saving?
- With a single lump sum and no deposits or withdrawals, order is mathematically irrelevant because you are just multiplying the same set of growth factors together, and multiplication is commutative. Running the S&P 500 total returns from 1996 to 2025 forward or backward turns $1 million into exactly $18,717,165 either way. Once you add regular contributions the order does start to matter, but a saver adding money to a falling market is buying more shares, which is the opposite of a retiree selling them.
- What happened to someone who retired in 2000 using the 4% rule?
- A January 2000 retiree with $1 million held entirely in the S&P 500, withdrawing $40,000 in year one and raising it 3% a year for inflation, ran out of money in 2023, three years short of a 26-year run. The portfolio fell to $539,242 by the end of 2002 and to $391,252 after 2008. Over the same period, $1 million left untouched grew to $7,388,152 at an 8.00% annual compound rate.
- How do you protect against sequence of returns risk?
- The four defenses that hold up are a cash or short-bond reserve sized in years of spending, a genuinely diversified and rebalanced portfolio rather than all equities, a flexible spending rule that cuts withdrawals after bad years, and delaying Social Security to age 70. Rebalancing does the heaviest lifting: the same January 2000 retiree at 60/40 instead of 100% stocks finished 2025 with $965,495 rather than zero.
- Is the 4% rule still safe?
- Probably, but with less margin than the number's fame suggests. William Bengen's 1994 study found that a 4% first-year withdrawal had never exhausted a portfolio in under 33 years of US history, and he recommended holding as close to 75% stocks as possible and never under 50%. Morningstar's The State of Retirement Income, 2025 edition, published December 3, 2025, put the safe starting rate at 3.9% for a 30-year horizon at 90% success with a 30% to 50% equity weighting.
Written by
Tech Talk News Editorial
Computer engineering background. Writes about software, AI, markets, and real estate, and the places where the three meet.
More about the author